PGS and TGS have merged to form a pioneering data and services company in the energy sector, serving customers across the energy value chain and positioning itself as a strategic partner for energy companies. Explore our vision.
Business Highlights 2019
PGS’ contract prices were close to 40% higher in 2019, compared to average 2018 pricing.
The order book nearly doubled during 2019, improving the business base going into 2020.
Higher project activity enabled PGS to continue operating eight vessels during the winter season, compared to the seasonal reduction to six vessels in previous years to adjust to lower winter-season demand.
Capital expenditures were kept at a low level in 2019.
Cash flow improved, and PGS reduced net interest-bearing debt by more than $100 million in 2019 and increased the liquidity reserve by approximately $50 million.
PGS completed the sale of Ramform Sterling to JOGMEC, including a service agreement of up to 10 years with annual renewals.
Following sale of the Ramform Sterling, Ramform Vanguard was successfully re-introduced to maintain the operated 3D fleet size of eight vessels.
PGS also initiated a digital transformation process and entered into an agreement with Google Cloud as the Company’s preferred cloud provider.
Early 2020, PGS completed a refinancing of its 2020 and 2021 debt maturities combined with a $95 million equity raise. The refinancing extended the maturity of the Company’s revolving credit facility and term loan to 2023 and 2024.
Segment EBIT ex. impairment and other charges, net
96.4
36.3
(147.1)
Profit and loss numbers As Reported
Revenues
930.8
874.3
838.8
EBIT
54.6
39.4
(383.6)
Net financial items
(92.2)
(87.3)
(84.5)
Income (loss) before income tax expense
(37.6)
(47.9)
(468.2)
Income tax expense
(34.1)
(40.0)
(55.2)
Net income (loss) to equity holders
(71.7)
(87.9)
(523.4)
Basic earnings per share ($ per share)
(0.21)
(0.26)
(1.6)
Other key numbers As Reported by IFRS
Net cash provided by operating activities
474.3
445.9
281.8
Net cash provided by operating activities
244.8
277.1
213.4
Capital expenditures (whether paid or not)
59.1
42.5
154.5
Total assets
2,301.7
2,384.8
2,482.8
Cash and cash equivalents
40.6
74.5
47.3
Net interest-bearing debt*
1,007.5
1,109.6
1,139.4
Net interest-bearing debt, including lease liabilities following IFRS 16*
1,204.6
*Following implementation of IFRS 16, prior periods are not comparable to December 2019
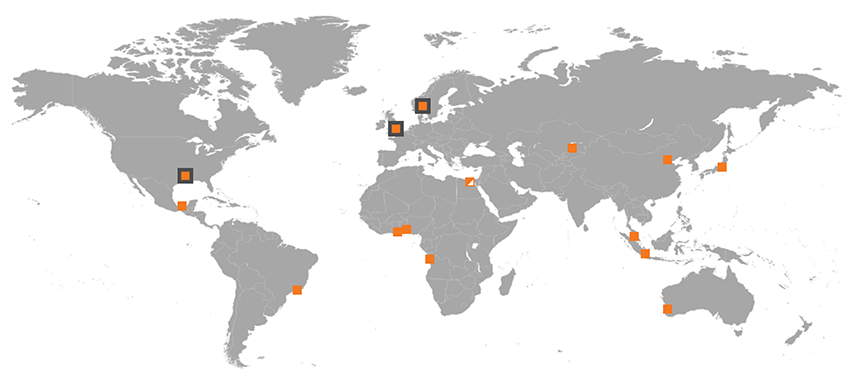
People and Places
Headquartered in Oslo, Norway, PGS has offices in 16 countries around the world as of year-end 2019 and operates regional centres in London and Houston.
Luanda, Angola | Perth, Australia | Rio de Janeiro, Brazil | Beijing, China | Cairo, Egypt | Accra, Ghana | Jakarta, Indonesia | Tokyo, Japan | Almaty, Kazakhstan | Cyberjaya & Kuala Lumpur, Malaysia | Villahermosa, Mexico | Lagos, Nigeria | Oslo & Stavanger, Norway | Singapore, Singapore | Weybridge, UK | Austin & Houston, US