

Swift response to Covid-19 market disruption by substantial cost and capex reduction, and two year maturity extension and amortization holiday on debt
Delivered strong vessel and Imaging project execution in 2020, despite Covid-19 restrictions and challenges
Entered into a strategic partnership with TGS and CGG to offer clients a single point to access MultiClient data libraries
Manifested leading position in Egypt by securing 15 vessel months of Ramform Titan-class acquisition work, capitalizing on PGS’ integrated service offering
Reached important milestones in the digital transformation process by developing a Cloud based MultiClient sales platform, achieved tangible results in optimizing vessel operation and commenced commercial imaging projects in the Cloud
Financial Calendar
| Annual General Meeting | April 21, 2021 |
| Q1 2021 Earnings Release | April 22, 2021 |
| Q2 2021 Earnings Release | July 22, 2021 |
| Q3 2021 Earnings Release | October 21, 2021 |
| Q4 2021 Earnings Release | January 27, 2022 |
Key Figures
| USD Millions | |
| 2017 | 838.8 |
| 2018 | 834.5 |
| 2019 | 880.1 |
| 2020 | 595.9 |
| Percentage | |
| Contract - 25% | 25 |
| MultiClient - 65% | 65 |
| Imaging - 4% | 4 |
| Other - 7% | 7 |
| USD Millions | |
| 2017 | 697.5 |
| 2018 | 601.6 |
| 2019 | 579.8 |
| 2020 | 426.2 |
*2020 includes government grants relating to the Covid-19 pandemic of $38.8 million.
Segment Revenues by Business Activity
| USD Millions | |
| 2017 | 534.4 |
| 2018 | 654.3 |
| 2019 | 529.6 |
| 2020 | 385.9 |
| USD Millions | |
| 2017 | 241.3 |
| 2018 | 149.5 |
| 2019 | 318.8 |
| 2020 | 146.7 |
| USD Millions | |
| 2017 | 51.0 |
| 2018 | 25.8 |
| 2019 | 29.1 |
| 2020 | 23.6 |
Key Financial Figures
| In USD million | 2020 | 2019 | 2018 |
| Profit and loss numbers Segment Reporting | |||
| Segment Revenues and Other Income | 595.9 | 880.1 | 834.5 |
| Segment EBITDA ex. other charges, net | 397.7 | 556.1 | 515.9 |
| Segment EBIT ex. impairment and other charges, net | 12.2 | 96.4 | 36.3 |
| Profit and loss numbers As Reported | |||
| Revenues and Other Income | 512.0 | 930.8 | 874.3 |
| EBIT | (188.0) | 54.6 | 39.4 |
| Net financial items | (118.4) | (92.2) | (87.3) |
| Income (loss) before income tax expense | (306.4) | (37.6) | (47.9) |
| Income tax expense | (15.1) | (34.1) | (40.0) |
| Net income (loss) to equity holders | (321.5) | (71.7) | (87.9) |
| Basic earnings per share ($ per share) | (0.85) | (0.21) | (0.26) |
| Other key numbers As Reported by IFRS | |||
| Net cash provided by operating activities | 366.5 | 474.3 | 445.9 |
| Cash investment in MultiClient library | 222.3 | 244.8 | 277.1 |
| Capital expenditures (whether paid or not) | 36.1 | 59.1 | 42.5 |
| Total assets | 2 093.8 | 2 301.7 | 2 384.8 |
| Cash and cash equivalents | 156.7 | 40.6 | 74.5 |
| Net interest-bearing debt** | 937.6 | 1 007.5 | 1 109.6 |
| Net interest-bearing debt, including lease liabilities following IFRS 16** | 1 096.2 | 1 204.6 |
**Following implementation of IFRS 16, prior periods are not comparable to December 2019 and December 2020.
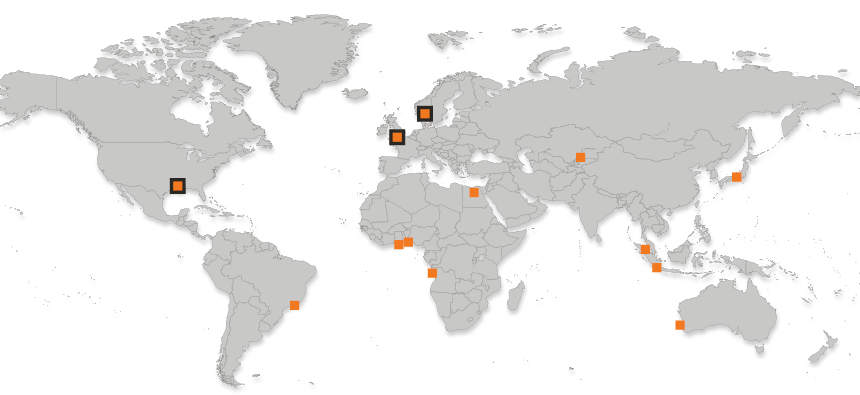
People and Places
Headquartered in Oslo, Norway, PGS has offices in 14 countries around the world as of year-end 2020 and operates regional centres in London and Houston.
| Average Number of Employees | |
| 2017 | 1436 |
| 2018 | 1247 |
| 2019 | 1248 |
| 2020 | 862 |