

A collaborative study between PGS, Neptune Energy and OMV (Norge) outlines a process that enables operators to save both time and costs on conducting conventional site surveys by applying separated wavefield imaging (SWIM) to existing 3D seismic data.
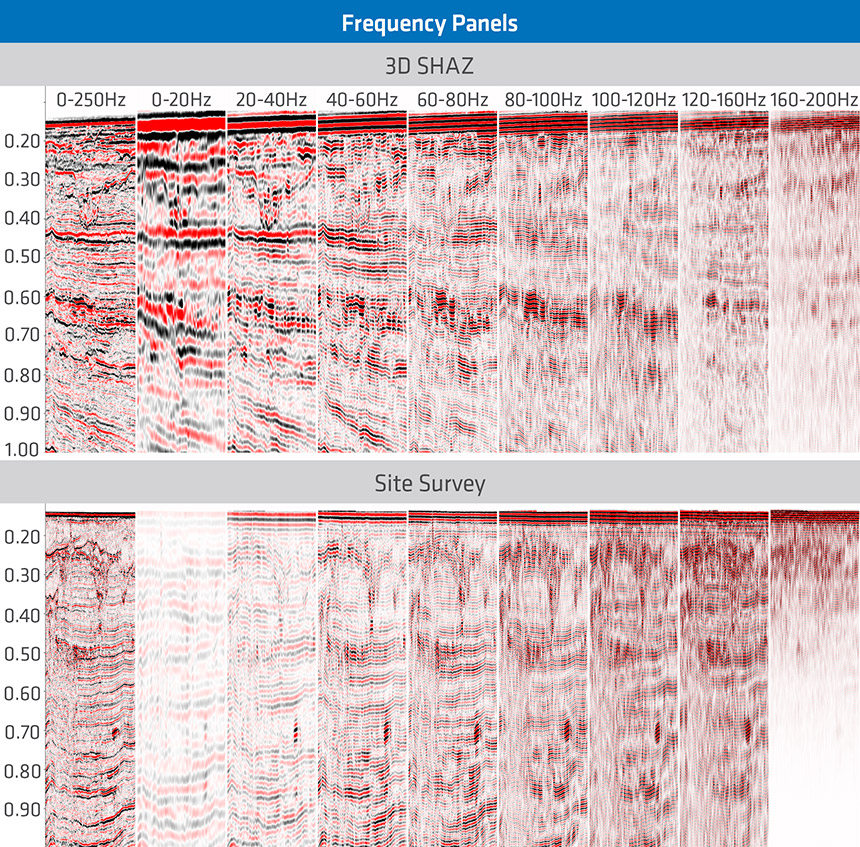
An innovative reprocessing sequence for GeoStreamer multisensor data delivers images that can replace dedicated site surveys. It can even be run on data originally acquired for exploration purposes. GeoStreamer shallow hazard (SHAZ) data are significantly richer in low frequencies than traditional site surveys with the advantage of being a full 3D volume. The proposed SHAZ workflow is most suited to shallow and medium water depths.
The approach used in the First Break study was to adjust standard 3D processing flow parameters to provide substantially better and artifact-free images for frequencies up to 220 Hz. Advanced imaging and inversion techniques were used pushing the frequencies to the limits of the frequency bandwidth and this was enabled by the multisensor deep-towed streamer data which has reduced noise and free-surface interferences.
As the SHAZ project progressed the authors observed that high-resolution reprocessing of 3D exploration seismic data (2 ms) is beneficial down to approximately 1 200 ms TWT in this case. All the near-angle information missing in the high resolution Kirchhoff migrated gathers were taken from the migrated SWIM gathers and then stacked together to produce the final SHAZ volume. This volume is free of acquisition footprint issues typically seen on exploration seismic surveys in shallow water areas.
The imaging techniques described here can easily be used on a number of licenses due to the large available coverage of high-quality multisensor broadband data at 2 ms sampling. Another avenue of potential improvement is to include detailed FWI work if it was done at large scale at the conventional imaging stage.
Contact a PGS expert
If you have questions related to our business please send us an email.