

A better tool has been developed for analyzing the relative uncertainty and hence reliability of earth models. This provides interpreters with useful new metrics that can be used to assess and mitigate risk related to structural ambiguity. Used in combination with seismic data, it can even improve target positioning and volumetrics calculations.
Reservoir evaluation is often based on the interpretation of a single seismic image. This image is traditionally the result of a tomographic velocity model building process followed by prestack depth migration and is used as the basis for critical economic evaluations of either prospective or confirmed hydrocarbon accumulations. Surprisingly, the amount of uncertainty associated with the image and the velocity model that was used to generate it, are poorly understood and often not quantified. Usually, the only evaluation of the quality and reliability of the produced image is achieved by comparison with auxiliary data such as well markers, or by assessing the overall degree of gather flatness or structural simplicity that is displayed in the final prestack depth images.
Given the significant non-linearity inherent in the tomographic methods to derive the earth model, multiple realizations of the same model can be produced that similarly honor the constraining data and yield the same overall gather flatness. Yet these models can vary significantly, resulting in substantially different interpretations of critical reservoir features.
PGS has recently developed a new analysis tool that quantifies the aforementioned inherent image uncertainties. These additional metrics can be used by interpreters to better understand the reliability of their reservoir interpretation, and assist in mitigating risk associated with any structural ambiguity.
Characterizing Model Uncertainty
The resolution over which a model parameter (e.g. velocity) is constrained by the observed data (e.g. seismic gather flatness) during the tomographic inversion is dependent on many variables. These include factors such as decisions taken within the initial migration namely the spatial sampling of the image space. Additionally, resolution will be strongly affected by the acquisition geometry and also influenced by subsurface geology, which will determine the local impedance contrasts that will give rise to reflections from which the velocity information is extracted from. Wherever such impedance contrasts are absence or sparse, velocity information will be poorly resolved.
The tomography workflow characterizing model uncertainties uses PGS’ hyperTomo engine and comprises a number of stages. In the first step, the maximum spatial resolution of the tomographic velocity update is established. The minimum spatial wavelength and amplitude of any velocity perturbation that can be resolved by the tomographic inversion process is calculated using a classic checkerboard test. Once the intrinsic resolution of the inversion process has been established, a large population of perturbated models is generated from a given velocity model. The model population all consistently fit the observed data. Migrations are then performed for all perturbation models and residual moveout metrics are generated from the resulting common image gathers. Finally, a tomographic inversion is performed for all the perturbations and the resulting inversion model is compared to the starting model to establish the individual inversion error. A statistical analysis of the total population of inverted models is performed for each grid location to reveal the mean, variance and standard deviation of the local inverted velocity. 3D volumes are computed for all three statistical parameters. Additionally, a spatial reliability indicator is created to give a positional error envelope for the data.
An example of the integrated use of these metrics is presented in the image below. The model variance cube generated with the new model uncertainty workflow is superimposed with the underlying 3D seismic image and the error envelope analysis. The combination of these additional deliverables provides interpreters with important information as to the local reliability of the seismic image that they are seeking to extract reservoir information from. Additional information about the local illumination strength, for example, can be added to highlight any possible correlations between poor illumination and high model uncertainty.
The additional products generated by the PGS model uncertainty workflow can be used in conjunction with seismic images to assist in mitigating risk associated with uncertainty in target positioning and volumetrics.
Contact us if you would like to learn more about the new model uncertainty workflow at imaging.info@pgs.com
The workflow will be demonstrated at EAGE Paris 2017, on the PGS stand #620.
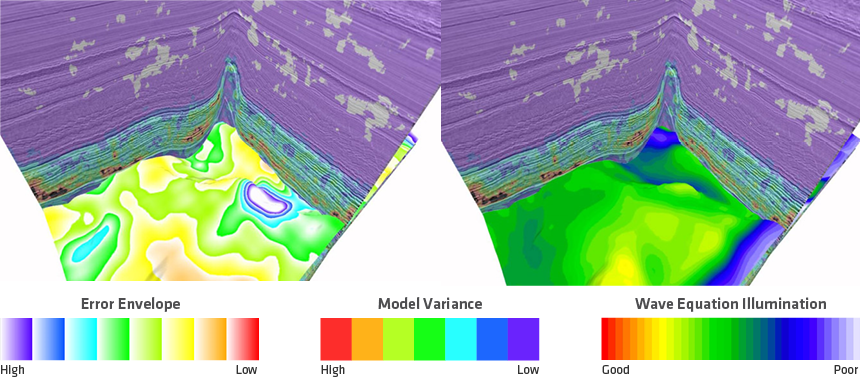 PGS seismic data with co-rendered model uncertainty variance attribute, error envelope analysis for one horizon (left) and illumination distribution on the same surface generated by wavefield extrapolation (right).
Contact a PGS expert
If you have a question related to our Imaging & Characterization services or would like to request a quotation, please get in touch.