

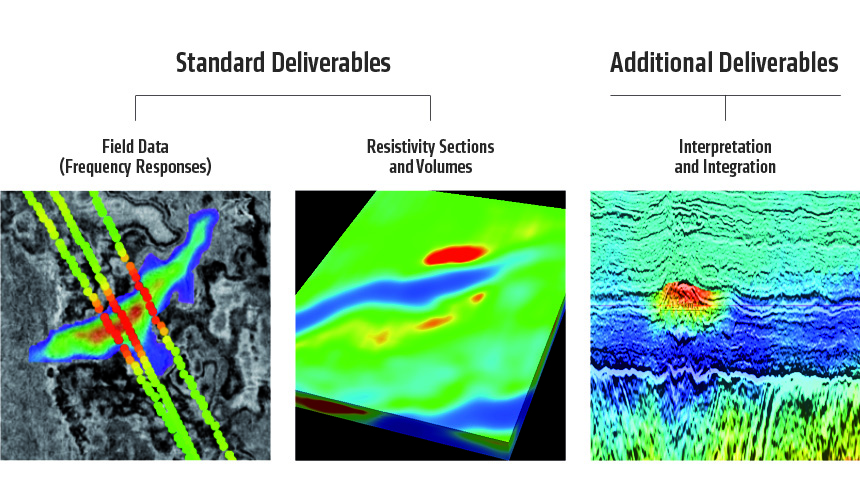
 Interpretation and integration reports can be supplied in addition to the standard EM frequency response and resistivity deliverables
This guiding is softer than traditional "constrained inversion", as the inversion is allowed to anticipate a significant change in resistivity at a certain horizon, but remains free to populate the cells in the inversion above this horizon in a manner which best fits the data.
It has been demonstrated that using seismic, well log and Towed Streamer EM data it is possible to accurately estimate hydrocarbon saturation and ultimately, total hydrocarbon volume in place.
Hydrocarbon Volume in Place
Seismic data are particularly well suited to resolving structure and aiding understanding of rock properties, but attempts to map fluids from seismic data alone may be misleading due to the ambiguity between fluid and lithology effects. In contrast, CSEM data is sensitive to the presence of hydrocarbons, but the diffusive nature of CSEM techniques generally results in lower resolution images. Careful integration and analysis of both types of data, where each is used according to its strengths, can help us improve reservoir understanding.
Rock physics models are the transforms through which we convert the rock and fluid descriptions into geophysical properties, such as resistivity or elastic moduli. The porosity is obtained from the acoustic impedance, whereas hydrocarbon saturation is obtained from the resistivity. The combined result of these provides a hydrocarbon volume (HCV) index, i.e. porosity multiplied by saturation.
Quantitative estimates of lithology and fluid properties are required to fully understand the character of a field and how best to develop and manage it once in production. The HCV index provides a clear indication of hydrocarbon distribution within the reservoir which enables improved production and injection well placement decisions, ultimately resulting in more efficient production and increased revenue.
As a technology leader, PGS has demonstrated how to integrate well log, GeoStreamer seismic and Towed Streamer EM data that enables analysis and understanding beyond those obtainable from just one type of data. By integrating* these complementary types of data PGS is able to offer estimates of the total volume of hydrocarbon in place within a reservoir. This focused data integration effort broadens the application of GeoStreamer seismic and Towed Streamer EM from exploration right through to field development and beyond.
*Integrated products and services provided under license from Rock Solid Images Inc, to patent numbers US8064287, US7912649 and US12/135,729 and their related families.
Workflow to Calculate HCV Index
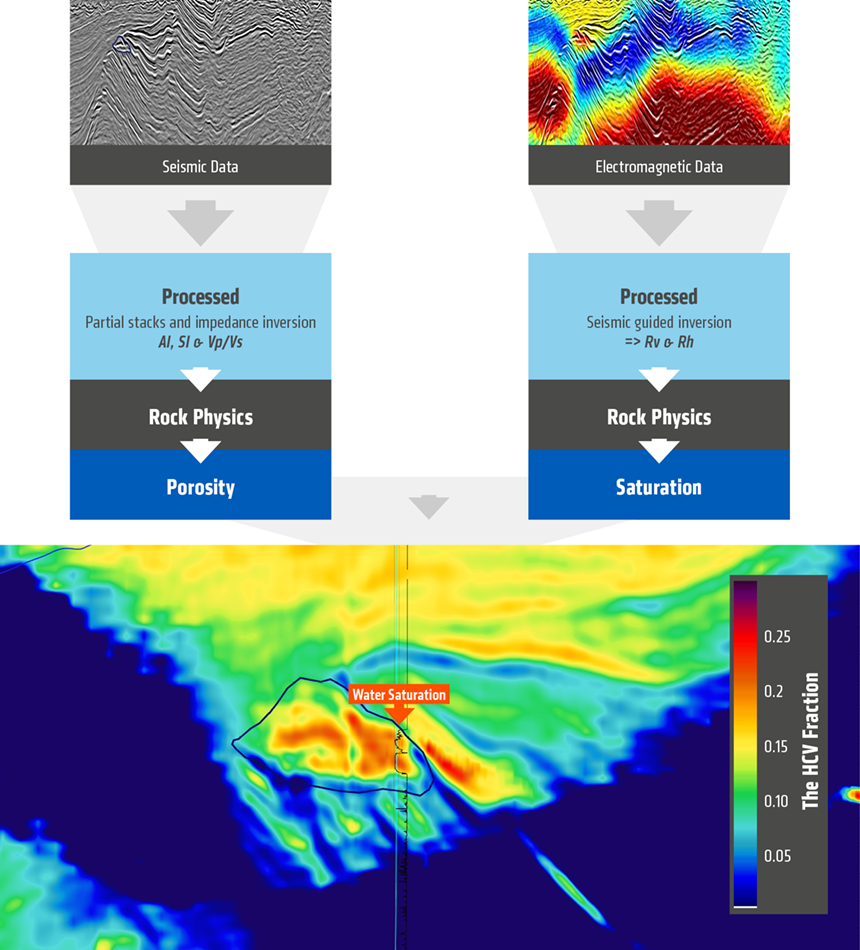 Seismic data can be inverted for velocity and acoustic impedance, while inversion of EM data provides resistivity. Correlating these improves hydrocarbon saturation estimates and calculation of the HCV index.